
Section 1: Variance (Part 1)
A general understanding of the role that variance plays in betting and in life can help prepare advanced investors for the swings that naturally occur in betting. “Variance” has a very specific definition in statistics, but for our purposes it will be used to describe the naturally occurring, short term hot and cold streaks which are an expected byproduct of a long-term winning trend.
Generally, even very educated people have an extremely poor grasp on just how much variance there is in sports betting. Consider that I have proven over a sample size of thousands of games that I can win 55% of my College Football bets in the long run; yet after weighing hundreds of factors, analyzing millions of bits of data, and running very complex statistical analysis, the chance that I predict my next game wrong is still 45%.
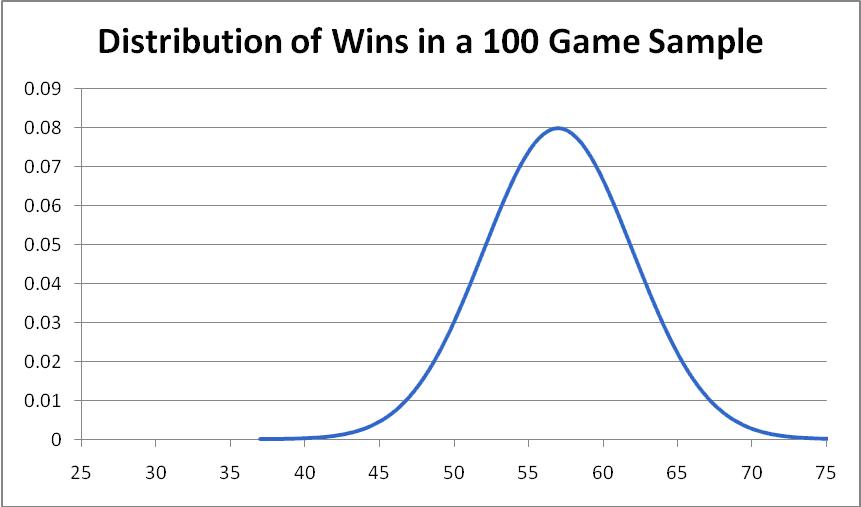
While things ‘even out’ in the long run, most people do not realize that stretches of 10, 50 or even a hundred games are still highly susceptible to variance. With a career winning percentage of 55%, my expectation over a 100 game sample is that I will win 55 games with a standard deviation of 5 games. The distribution below describes the probability that a randomly selected 100 game sample will have a certain number of wins based on a 57% win percentage:
Each 100 game sample is independent from the last sample. Just as a fair coin that has flipped five heads in a row is just as likely to come up tails on its next flip as it is to come up heads for a sixth time, my expectation is that I am 55% likely to win any games over each week or season – but the fewer games in the sample, the more variant it is likely to be.
| Wins | Prob. | Wins | Prob. |
|---|---|---|---|
| 38 | 0.02% | 56 | 7.82% |
| 39 | 0.05% | 57 | 7.37% |
| 40 | 0.09% | 58 | 6.66% |
| 41 | 0.16% | 59 | 5.79% |
| 42 | 0.27% | 60 | 4.84% |
| 43 | 0.45% | 61 | 3.88% |
| 44 | 0.71% | 62 | 2.99% |
| 45 | 1.08% | 63 | 2.22% |
| 46 | 1.58% | 64 | 1.58% |
| 47 | 2.22% | 65 | 1.08% |
| 48 | 2.99% | 66 | 0.71% |
| 49 | 3.88% | 67 | 0.45% |
| 50 | 4.84% | 68 | 0.27% |
| 51 | 5.79% | 69 | 0.16% |
| 52 | 6.66% | 70 | 0.09% |
| 53 | 7.37% | 71 | 0.05% |
| 54 | 7.82% | 72 | 0.02% |
| 55 | 7.98% | 73 | 0.01% |
The graph of the distribution visually demonstrates the probability of a given outcome – the higher the blue line is over a given number, the more likely a random 100 game sample is to have that many wins. The chart enumerates this same data explicitly. As you can see, most 100 game samples net between 50 and 60 wins, although about one out of every five 100 game samples (21.35%) will have between 46-49 or 61-64 wins. I would also expect that in one out of every 18 seasons (5.67%), I will win less than 48 out of 100 games and in one out of every 18 seasons I will win 63 or more out of 100 games! Five percent may not sound like very much, but when you consider that I have been doing this for thirty-seven years now, you would actually expect me to have had a few years with extremely lucky results and a few seasons with extremely unlucky results.
When we examine my record, we see that this is in fact exactly what has happened. Over 37 years of college football, I have had four of those 2-standard-deviation outlier seasons (two positive and two negative), a bunch of 1-standard-deviation plus or minus seasons, and many more seasons right around expectation. In 2005, I experienced a season that was unusually lucky (I went 51-21 (70.8%) overall and 136-49 (73.5%) on a star basis), and in 2007 I experienced a season that was unusually unlucky (I went 32-42 (43.2%) overall and 78-111 (41.3%) on a star basis). For a bettor whose lifetime record over thousands of games is 55%, and whose record will continue to be 55% looking forward, having one or two seasons as bad as 2007 or a season as good as 2005 (or both) over the years is completely normal and totally expected.
However, even some very smart investors don’t realize how completely standard it is to have up and down seasons when dealing with sample sizes of less than 200 games per season. In 2005, some were predicting that I would continue to win 65% of my games year in and year out and bring Las Vegas to its knees begging for mercy, ignoring the fact that I had picked around 57% for the previous 18 years. In fact, I actually wrote an email to my subscribers begging them not to be fooled by randomness, and to assume that I would continue to win 57% of games in the future just like I always had, rather than the 70% I was winning during this hot streak. What happened? You guessed it – in 2006, I won exactly 57% (45-34-3) of my college football Best Bets.
In 2007, hundreds of players across forums, pundits on news radio stations and dishonest touts seeking new customers again ignored the fact that I had picked 57% over a 20-year period, and declared an end to my two decades of winning. They accused me of everything from being over the hill to intentionally releasing the wrong side of games so that I could bet the opposite to selling out to Vegas insiders. To people who don’t understand variance, these were the only plausible explanations for a 57% bettor winning only 43% of his games over a 74-game stretch. Yet to careful thinkers, a particularly unlucky streak was bound to hit sooner or later, was completely normal, and had absolutely no bearing on my future picks. What happened? You guessed it – in 2008, I won 58% (43-31-4) of my college football Best Bets.
In an industry rife with touts hitting 15-2 hot streaks, cranking up their bet sizes and then blowing their entire bankroll when variance swings the other way, there is something delightfully un-sexy about ignoring artificially created time periods, and embracing sports investing as a long term, cash-generating enterprise. The best analysts do not try to predict exactly what will happen in one ‘lock of the week,’ but rather they try to use their data, metrics, and models to determine the probability distribution of various outcomes, and to put their money on the slightly more probable outcome over and over again, day after day, and sleep easily at night no matter who wins.