
Section 2: Variance (Part 2)
Statistical variance is not limited to gambling. The exact same probability distribution curve applies to anything that has multiple outcomes with fixed probabilities – coin flips, dice rolls, free throws, poker hands, batting percentage, etc.
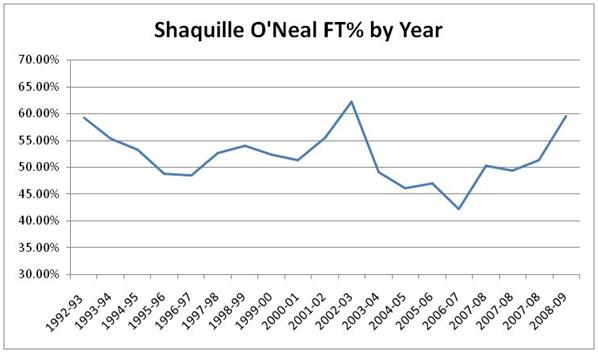
For example, Shaquille O’Neal made 53% of his free throws over his career, and his season percentages fluctuated between 42% and 59%, with no real discernible upward or downward trend. Even with a few hundred shots per year, there is a lot of variance – he shot as high as 62% in the 02-03 season, and as low as 42% in the 06-07 season. Yet at the end of it all, he was still the same 53% shooter that he always was. If you examine all of the 100 free throw ‘samples’ throughout his career, he has some periods where he only made 30 out of a 100-shot sample, and some periods where he made 70. During these periods, announcers would often talk about how he was particularly hot or cold for a particular reason but in reality it was just short-term randomness. Over the course of shooting 53% over ten thousand free throws, you are going to have some really cold streaks and some really hot streaks, which can be attributed to simple, expected variance.
As another example, consider Johnny Damon, a lifetime .289 hitter. During the first 40 games of the 2008 season, Johnny Damon was batting only .252. Does this mean that he had gone cold, or that he would be expected to bat .252 for the rest of the season? Does this mean that he was ‘due’ for a hot streak? Of course not – it was just a below expectation sample of 151 at-bats, and going forward (barring any major injuries, trades, aging, etc.) you would expect him to continue to hit .289 just as he had his whole career. Damon then hit .318 over the next 40 games, and then .355 over the 40 games after that. Analysts with no statistical knowledge assumed that the gradual upward trend was bound to continue, and that he would obviously hit even better over his last 40 games, but of course the two periods were merely above expectation and he hit .267 over his last 40 games for a season average of .299, right about his career average.
So the next time you happen to go 2 out of 10 on coin flips, or I happen to win 25 out of 35 games, or Buster Posey goes 8 games without a hit, or the sales rep that usually closes half of his calls only closes two out of his last twenty attempts, remember that while it is always possible there are underlying causal reasons, it’s also possible that you are witnessing nothing other than short term variance.
The key to sports betting is to stick to your strategy. If you planned to wager 1.5% per star, don’t increase or decrease that amount because I hit a hot or cold streak, and don’t trick yourself into thinking the last 100 games mean more or are more predicative of results than the thousands of games that came before that.