
Winning preseason games often comes down to which coach/team is more motivated to win and the second week of the preseason offers a good investment opportunity based on motivation. In general, most NFL coaches don’t really care about winning a preseason game, but I’ve found that teams that lose their first preseason game have been good bets against teams that already have a win under their belt, which makes them even less likely to care about winning.
Teams playing their 2nd preseason game that lost their preseason opener are 100-58-3 Against The Spread (ATS) since 1994 when facing teams coming off a win in their preseason opener.
Situations are only meaningful if they make sense and that’s a pretty solid situation that makes sense to me since it speaks to a team’s motivation, which is a key factor in preseason games.
A subset of that situation is an even better 59-14- 1 ATS and I’ve posted the qualifying plays each of the last 5 years. The qualifying games are not likely continue to win at such a high percentage but the record the last 5 years since I started posting the plays is 14-4. Let’s hope for more of the same this year.
This year’s qualifying plays to that 59-14-1 ATS subset are:
Thursday, August 16
Philadelphia (+3.5) over New England (20-37, Loss)
Washington (-2/-1) over New York Jets (15-13, Push or Win, depending on your line, which dropped to -1 on Tuesday afternoon and closed with Jets favored by 2)
Friday, August 17
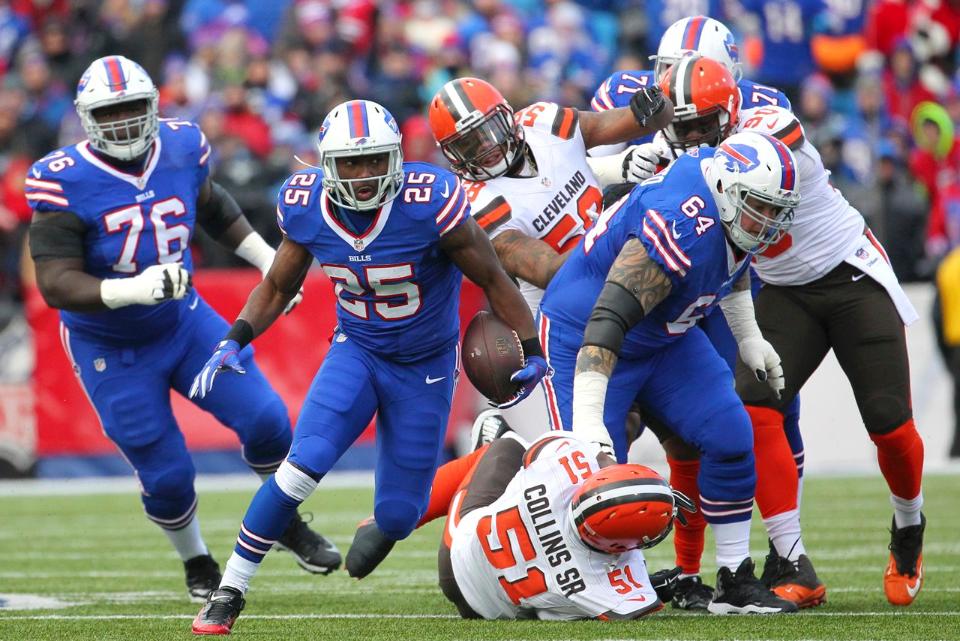
Buffalo (+3.5/+3) over Cleveland (19-17, Win)
Saturday, August 18
Jacksonville (+4.5/+4) over Minnesota (14-10, Win)
Also, last week I posted an
NFL week 1 regular season Best Bet
The only preseason games I play are based on this angle, as my time in August is better spent gearing up for the regular season.
Dr Bob Sports NFL Best Bets Service
2016 was the first season using the new play-by-play model and my NFL Best Bets the last two seasons are a very profitable 137-101-2 (58%). Prior to 2016 my NFL Best Bets were based on situational analysis and my original math model, which performed very well for many years but offered very little value in later years. My NFL Best Bets were 57.8% from 1987 through 1998 but were just 50.6% from 1999 through 2012, which is when I decided to stop handicapping the NFL until I had a better model.
The new play-by-play model was introduced in 2016 with very good results and an improvement to the model was introduced starting in week 11 of the 2017 season that improved results (21-10-1 on Best Bets the last 10 weeks of the season). Work was done this summer to fine tune the model and the back-tested results were very good – particularly on totals, which have underperformed the last two seasons. I am very excited about the improvement to the play-by-play predictive model and look forward to a profitable 2018 season.
2016-17 NFL Best Bets were 137-101-2 (57.6%) – 92-48-2 on sides, 44-48 on totals, 1-2 1st-half totals, 0-1 team totals, 0-1 teasers, 0-1 season win totals.
2016-17 NFL Strong Opinions were 92-71-4 (56.4%) – 41-43-3 sides, 43-27-1 totals, 1-0 1st-half totals, 7-1 Super Bowl prop bets.
2017 NFL Best Bets were 37-32-2 (26-22-2 sides, 10-5 totals, 1-2 1st-half totals, 0-1 team totals, 0-1 teasers, 0-1 season win totals) and Strong Opinions were 28-19 (14-13 sides, 7-4 totals, 1-1 1st-half totals, 6-1 Super Bowl prop bets).
View All Dr. Bob Sports Best Bet subscription packages
Dr Bob College Football Best Bets Service
My College Football Best Bets are 2038-1679-64 (55%) on a Star Basis for +219.6 Stars Since 1999 (+222.7 Stars on Sides, -32.7 Stars on Totals, and +29.6 Stars on season win totals and futures) and the Strong Opinions are a profitable 637-560-15 (578-498-14 on Sides and 59-62-1 on Totals).
My 2017 College Best Bets were a decent 56-47-2 but I feel my level of handicapping was better than that record. My 101 Best Bets (excluding the 4 season win totals) combined to cover by a total of 229 points, which is an average of +2.3 points, despite my side Best Bets being -9 in fumble margin, which is random and worth about 36 points. A line differential of +2.3 points would normally equate to a win percentage of 56.1% winners, which is the best indicator of my handicapping level in 2016.
View All Dr. Bob Sports Best Bet subscription packages
View information on all Best Bet services