Game Analysis
Note: This was a 1-star Best Bet, with analysis released to clients.
Pittsburgh (-3) @ Washington
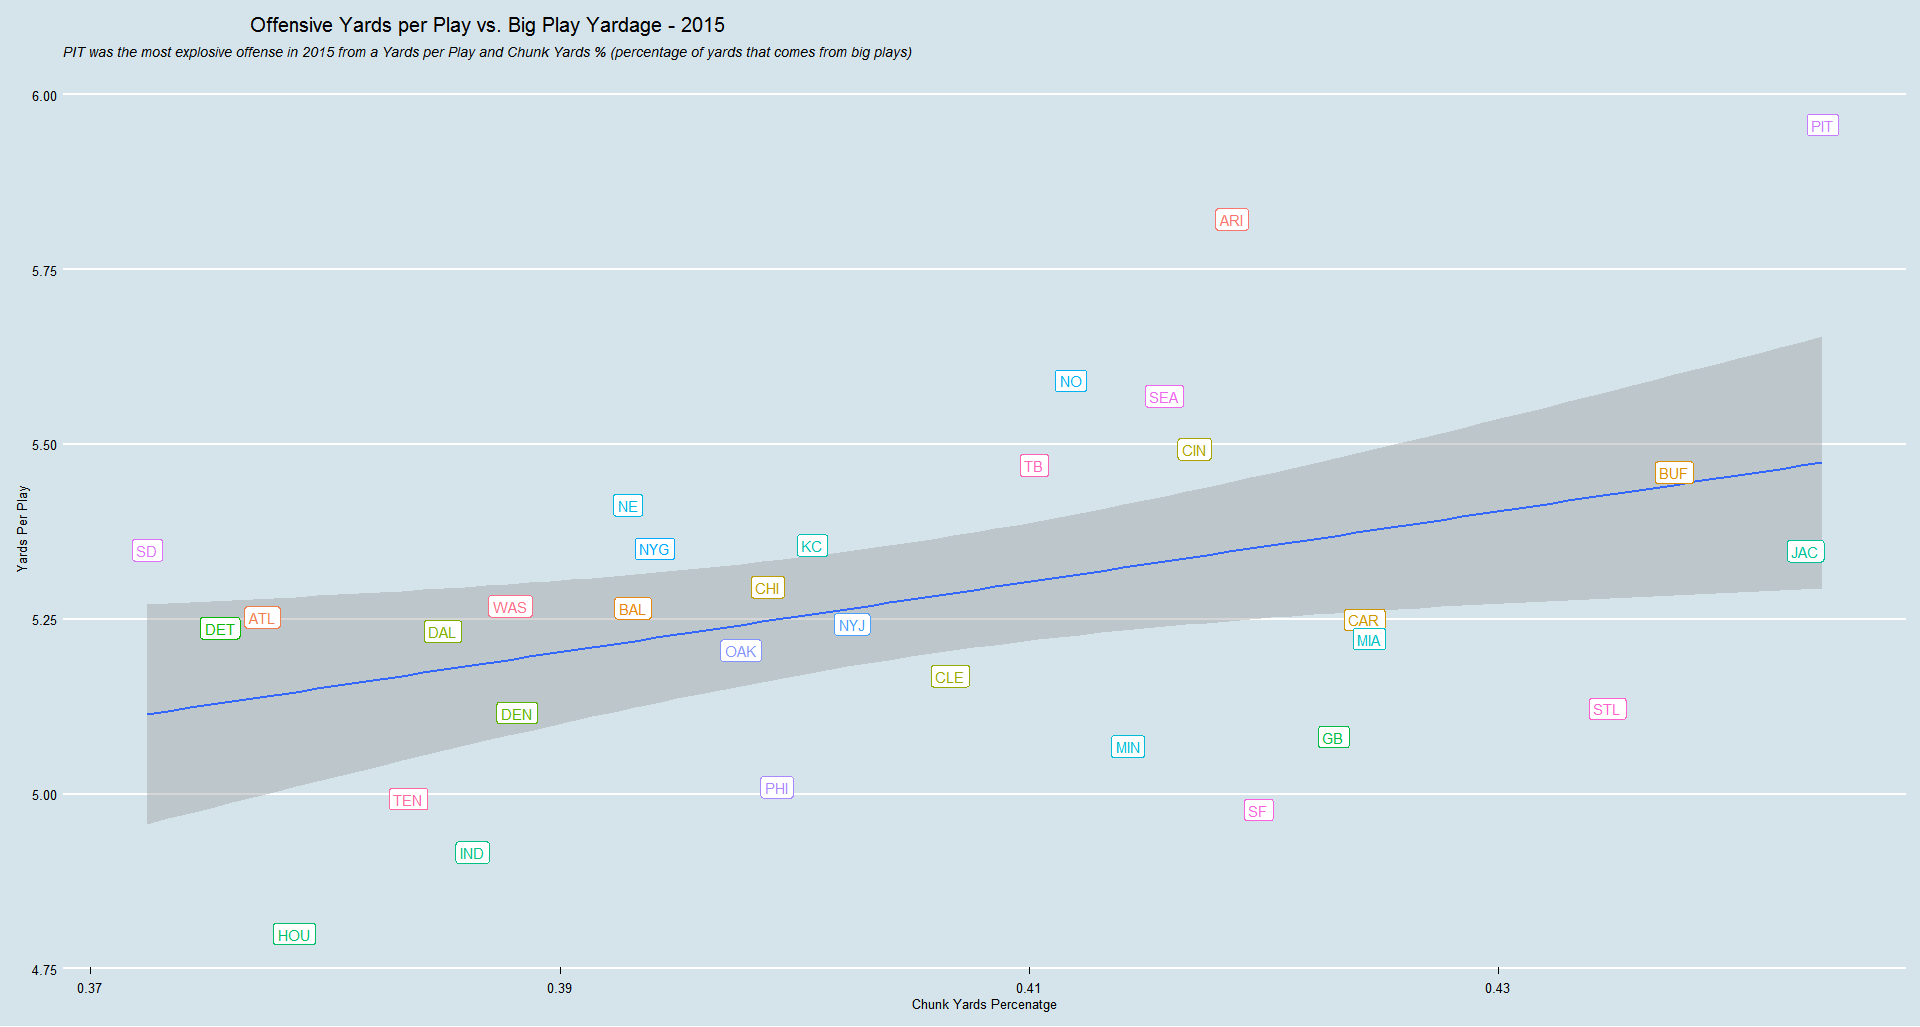
The early Monday Night Football Game features two potent offenses from last year, albeit units which had success with different approaches. Washington’s offense was one of the most efficient passing units, from an early down passing and third down passing perspective, while Pittsburgh featured the most explosive offense in the NFL last year. In an unique match-up of styles this is a bout between a big puncher looking for the KO and the technical fighter with the consistent jab, looking to win it in the cards.
Week 1 Methodology
With a higher degree of uncertainty surrounding teams beginning the season, game lines are the least correlated with actual performance in Week 1, with only 14% of the variance explained vs. 20% for weeks 2-17. Our Week 1 selections are based on advanced statistics (adjusted for down, distance and opponent quality), the significance of these factors was then run through various models to systematically determine variable importance and linear/non-linear effects. Model tuning, ensembling and testing was then performed to uncover game spread mispricings.
Pittsburgh faces the difficult task of going into Washington without 3 of its top 4 receiving threats penciled in to contribute at the beginning of the summer. With L. Green, M. Wheaton and M. Bryant all out for the opening game of 2016, the PIT offense will face uncertainty from a different cast of characters. Still with all-world WR Antonio Brown and Big Ben, the Steelers have the principal components to continue making field stretching plays this year. While Roethlisberger and Cousins both posted two of their best years last season, Big Ben has consistently proven to be a QB who can shoulder his team, regardless of the cast.

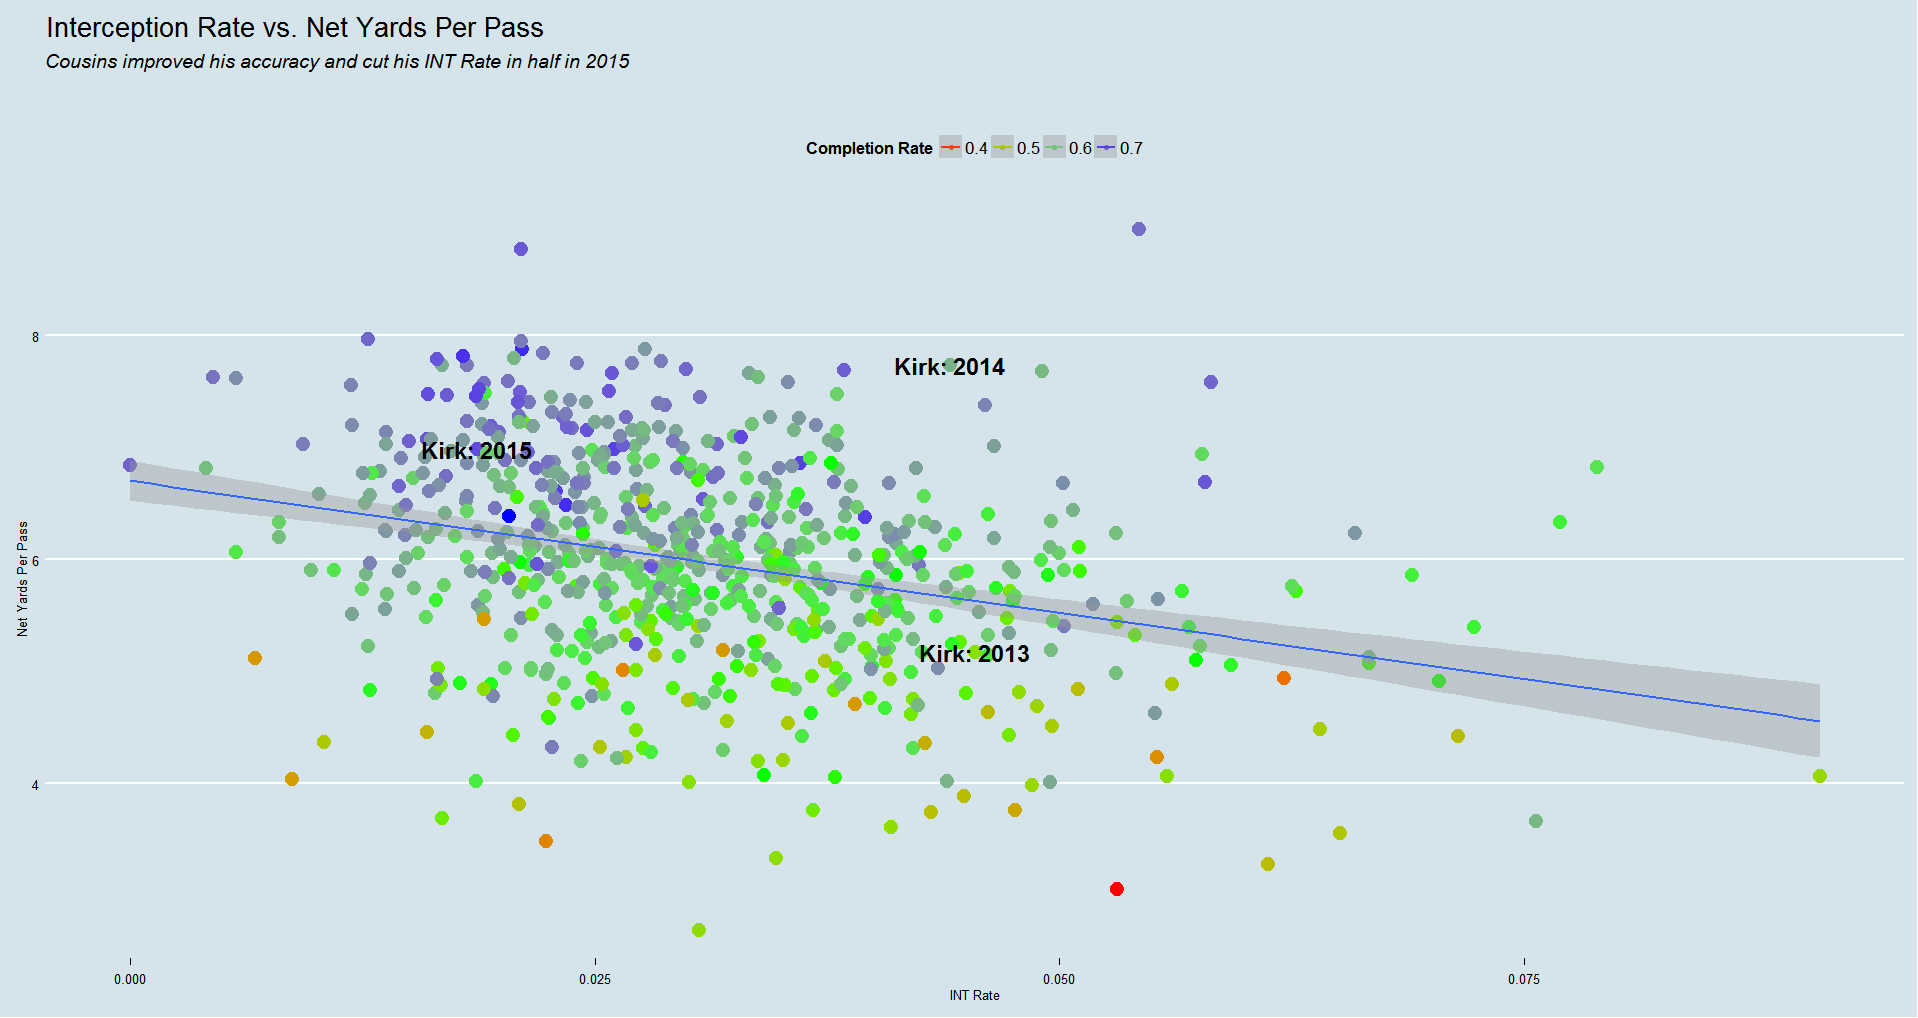
Washington made the playoffs last year from the significant improvement they saw in their passing game, particularly through raising their passing efficiency and lowering the sacks allowed rate. Kirk Cousins earned the starting QB role in Washington last year by playing more efficient football, on all downs, but particularly on third down, he was one of the best. However, third down success is highly variable year to year, as having success the year prior on passing third downs does not correlate to success the next year. Cousins also delivered the lowest interception rate of his career. While Cousins cut his interception rate to 2%, the top of the list of QBs who have seen a similar reduction in interception rate (under 2% over 200 attempts) is filled with signal and noise, including J.McCown (2013), J. Freeman (2010) and D. Brees (2004)

The team that wins the big play yardage margin (More % of yards come from big runs or big passes) has the higher success rate only 51% of the time, although the way visiting teams can go on the road and win (and more importantly cover) is through plays that pick up chunks of yards, as these plays limit mistakes a team can make and at the minimum help flip the field. Road teams that win the Big Play margin battle are 61% ATS (1223-785-60) the past 15 years, and our model favors the Steelers, so we will make Pittsburgh a 1* Best Bet at -3 at -125 odds or better.
Pass
-
Pass Plays
38.0
43.0
-
Succ Pass Plays
60.5%
48.8%
-
Sack Rate
2.6%
0.0%
-
Int Rate
2.7%
4.7%
-
Deep Pass Rate
18.9%
11.6%
-
Big Pass Yards
74.0%
25.5%
-
NYPP
7.6
7.7
Rush
-
Rush Plays
32.0
12.0
-
RB YPR
4.6
4.3
-
Stuff Rate
12.5%
25.0%
-
Succ Rush Plays
65.6%
58.3%
-
Big Rush Yards
30.4%
21.8%
-
Yards Per Rush
4.6
4.6
Game
-
All Snaps
70.0
55.0
-
Early Down Succ
64.7%
58.1%
-
Succ Rate
62.9%
50.9%
-
Big Yards Rate
59.2%
25.0%
-
Yards Per Play
6.2
7.0
-
Fumble Lost Rate
0.0%
0.0%
-
Time Per Play (sec)
28.7
28.9
-
Run Ratio
45.7%
21.8%
-
Starting Field Pos
27.3
30.1
-
Dominance Rating
6.2
-6.2
Pass
-
Pass Plays
43.0
38.0
-
Succ Pass Plays
48.8%
60.5%
-
Sack Rate
0.0%
2.6%
-
Int Rate
4.7%
2.7%
-
Deep Pass Rate
11.6%
18.9%
-
Big Pass Yards
25.5%
74.0%
-
NYPP
7.7
7.6
Rush
-
Rush Plays
12.0
32.0
-
RB YPR
4.3
4.6
-
Stuff Rate
25.0%
12.5%
-
Succ Rush Plays
58.3%
65.6%
-
Big Rush Yards
21.8%
30.4%
-
Yards Per Rush
4.6
4.6
Game
-
All Snaps
55.0
70.0
-
Early Down Succ
58.1%
64.7%
-
Succ Rate
50.9%
62.9%
-
Big Yards Rate
25.0%
59.2%
-
Yards Per Play
7.0
6.2
-
Fumble Lost Rate
0.0%
0.0%
-
Time Per Play (sec)
28.9
28.7
-
Run Ratio
21.8%
45.7%
-
Starting Field Pos
30.1
27.3
-
Dominance Rating
-6.2
6.2
* game log stats denoted as Off/Def
| 2016 Game Log |
PASS |
RUSH |
GAMES |
| Wk |
Opp |
Score |
Time-weighted Score |
Succ Pass Plays |
Sack Rate |
Int Rate |
NYPP |
Succ Rush Plays |
Stuff Rate |
Yds per Rush |
All Snaps |
Early Down Succ |
Succ Rate |
Big Yards Rate |
Yds per Play |
Fum Lost Rate |
Run Ratio |
Starting Field Pos |
| 1 |
WAS |
38 – 16 W |
6.2 |
60.5% /
48.8% |
2.6% /
0.0% |
2.7% /
4.7% |
7.6 /
7.7 |
65.6% /
58.3% |
12.5% /
25.0% |
4.6 /
4.6 |
70 /
55 |
64.7% /
58.1% |
62.9% /
50.9% |
59.2% /
25.0% |
6.2 /
7.0 |
0.0% /
0.0% |
45.7% /
21.8% |
27.3 /
30.1 |
* game log stats denoted as Off/Def
| 2016 Game Log |
PASS |
RUSH |
GAMES |
| Wk |
Opp |
Score |
Time-weighted Score |
Succ Pass Plays |
Sack Rate |
Int Rate |
NYPP |
Succ Rush Plays |
Stuff Rate |
Yds per Rush |
All Snaps |
Early Down Succ |
Succ Rate |
Big Yards Rate |
Yds per Play |
Fum Lost Rate |
Run Ratio |
Starting Field Pos |
| 1 |
PIT |
16 – 38 L |
-6.2 |
48.8% /
60.5% |
0.0% /
2.6% |
4.7% /
2.7% |
7.7 /
7.6 |
58.3% /
65.6% |
25.0% /
12.5% |
4.6 /
4.6 |
55 /
70 |
58.1% /
64.7% |
50.9% /
62.9% |
25.0% /
59.2% |
7.0 /
6.2 |
0.0% /
0.0% |
21.8% /
45.7% |
30.1 /
27.3 |


 Pittsburgh Steelers
@
  Washington Redskins